

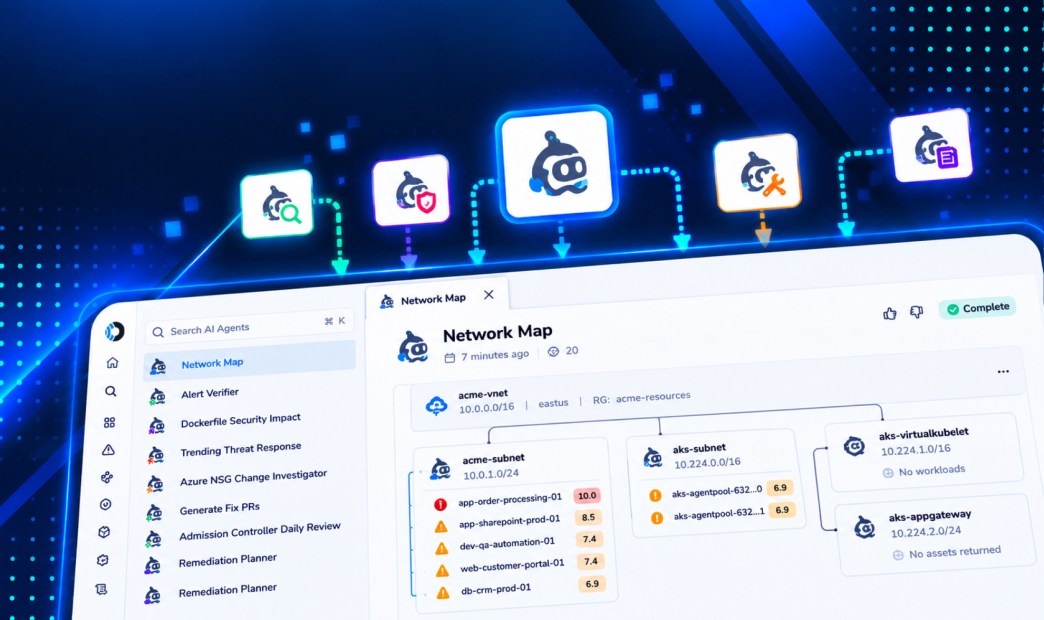


Ask most teams for a map of their network and you’ll get one of two things: a diagram someone drew for an audit two years ago, or an export from the firewall and cloud consoles showing what each rule allows. Both describe intent. Neither describes what an attacker on the internet can actually reach today.
The gap between the two is where incidents start. A database is marked “public network access enabled” but sits behind a private endpoint, so it isn’t reachable at all. A load balancer looks locked down in one console, but a CDN in front of it forwards traffic from anywhere. A subdomain still points at a cloud resource that was deleted months ago, and anyone can claim it.
Orca approaches the network map from the attacker’s side: follow the full path to every asset, then test the perimeter from the outside. Custom Agents turn that data into a map you can keep current without redrawing it by hand.
What usually goes into a network map?
A useful network map answers a short list of questions. Traditionally, each answer comes from a different source, maintained by a different team:
| What the map needs | Where it usually comes from | What Orca adds |
|---|---|---|
| An inventory of assets and addresses | CMDB, IP address management, spreadsheets | Cloud asset inventory across accounts, plus discovered domains, subdomains, and IP addresses |
| The ways in from the internet | Security group and load balancer configurations | An exposure rating for every asset, calculated across the full network path |
| The controls in front of each asset | Firewall, security group, and WAF rule exports | Security groups, cloud firewalls, Check Point firewalls, WAFs, and CDNs evaluated together, with labels showing which assets are fully or partly behind a WAF |
| Open ports and running services | Port scans, configuration review | Exposure rated per port, for services Orca finds running on the asset |
| Application and API endpoints | API gateway configurations, developer documentation | Discovered API endpoints, Swagger views, and a Network Exposure graph linking open ports to the application endpoints behind them |
| The condition of the perimeter | An annual penetration test | Ongoing external probing for subdomain takeover risk, certificate problems, exposed files, and debug panels |
| What sits behind the perimeter | Team knowledge | Attack paths, crown jewels, and the Internet and IAM Exposure Graph |
The traditional column has a common weakness: each source describes one layer, in one tool, as configured. Combining them is often done manually and made obsolete quickly.
Why isn’t the configuration enough?
Every cloud provider exposes its own public access settings, such as Azure’s PublicNetworkAccess flag. That setting records what a resource permits. It doesn’t answer whether the resource can be reached from the internet, and the two answers are often different.
Orca calculates exposure by following the full network path to each resource: firewall rules, network security groups, private endpoints, load balancers, WAFs, and CDNs. A resource that permits public access but sits behind a private endpoint isn’t reachable, so Orca doesn’t classify it as Public Facing. A virtual machine with a strict security group that receives traffic forwarded by a load balancer inherits the load balancer’s exposure.
Each asset ends up with one of a small set of exposure ratings:
- Public Facing: open to all IPv4 addresses
- Internet Facing: reachable from specific external addresses, including through CDNs
- Trusted Access: reachable only from IP ranges you’ve defined as trusted
- None: no external exposure found
Orca also rates exposure per port. An asset can be Internet Facing on port 443 while its other three open ports are Trusted Access or None. That’s the difference between “this server is exposed” and “this one service on this server is exposed,” and it’s the level of detail a network map needs.
A firewall rule tells you what one control allows. A network map has to show what the aggregation of controls allows, port by port.
What does testing from the outside add?
Network path analysis tells you what should be reachable. Orca’s external scanning and API security testing check what the perimeter looks like from the internet.
Orca probes the domains, subdomains, and endpoints it discovers and checks them against its Web & API Exposure Posture framework:
- Domain and takeover risks: expiring or expired domains, subdomains and CloudFront distributions at risk of takeover
- TLS and certificate hygiene: deprecated SSL or TLS versions, expired, self-signed, or mismatched certificates, unencrypted pages with password fields
- Exposed files and artifacts: environment variable files, .git paths, swagger.json files, phpinfo pages, and exposed secrets
- Debug and admin panels: known tools running in debug mode or exposing sensitive data without authentication
- Reputation: hosts and IP addresses that rate badly with reputation engines
These are findings no firewall export will show you, because they live in DNS records, web servers, and application code rather than in network rules.
For the addresses that matter most, the Attack Surface Red Agent goes further. It runs safe, AI-driven testing against a single domain or IP address, finding new endpoints and web vulnerabilities, and produces a structured report of what it scanned and what it found.
How does a Custom Agent turn this into a map?
The data above already lives in Orca. A Custom Agent assembles it into a map, organized the way your teams work, and keeps it current.
- Context: Global Context
- Trigger: Schedule, weekly
- Tools: Send Custom Slack Message, Open Jira Cloud Custom Ticket
- Use previous run as context: On
## Configuration
target subscription = [enter subscription name in quotes]
depth (topology or full) = [enter topology or full]
max resources shown per subnet = [enter a number]
security overlay = [on/off]
roll up empty VNets = [on/off]
## Role
You are a cloud network architect mapping one Azure subscription from Orca’s inventory for a security engineer who has never seen it. Report only what the inventory contains. An honest, incomplete map is better than a confident guess.
## Ground rules
* Evidence: Every placement, edge, and finding must trace to a field you actually read that held a value. If you don’t know, say “unknown” and list the candidates.
* Nulls: Never call a field empty unless you inspected it. If it’s empty where it shouldn’t be, re-fetch once and flag the disagreement.
## Process
1. Retrieve: Pull VNets, subnets, NICs, NSGs, VMs (including scale-set instances), AKS clusters, load balancers, bastions, NAT gateways, route tables, and private endpoints. Full runs also pull PaaS services and public IPs. Keep a ledger of records retrieved vs. total. Any shortfall makes the run INCOMPLETE, and that goes in the first sentence.
2. Frame: Attach subnets to VNets by parsing the SubnetId path.
3. Place workloads:
* Match region + CIDR first, never CIDR alone.
* Use NIC traversal only to resolve ambiguity.
* Use naming or resource-group convention as a last resort, clearly marked.
* Label each asset Confirmed, Inferred, Convention, Ambiguous, or Unplaceable.
4. Edges: Draw subnet → NAT/route table/bastion, NIC → public IP, load balancer → backends, and private endpoint → PaaS. Never infer peering.
5. Security overlay:Use Orca’s computed exposure, crown-jewel, and risk fields instead of re-reading NSG rules. Flag internet-facing crown jewels first, then lateral-movement and segmentation issues. Name the exact open port.
## Output
* summary
* retrieval ledger
* text hierarchy
* subnet inventory table
* findings and gaps
### Example Text Hierarchy:
Example 10.5.0.0/16 centralus RG:orca-demo
├── default 10.5.0.0/24 [NSG: NIC-level only]
│ ├── ~ orca-ubuntu-prod 10.5.0.8 pub:52.230.192.27 SSH:22 CJ OrcaScore:9.7 internet-facing
│ ├── ~ orca-web-server 10.5.0.4 pub:20.9.73.217 SSH:22 CJ OrcaScore:8.9 internet-facing
├── myappgatewaysubnet 10.5.2.0/24
│ └── NOT MODELLED: Application Gateway (absent from Orca)
└── AzureBastionSubnet 10.5.1.0/26
└── EMPTY (test-vm-vnet-bastion is in csd-4100, not this VNet)
## Self-checks
zero orphan subnets · every VM has a private IP · no model unexpectedly returns zero · placement counts add up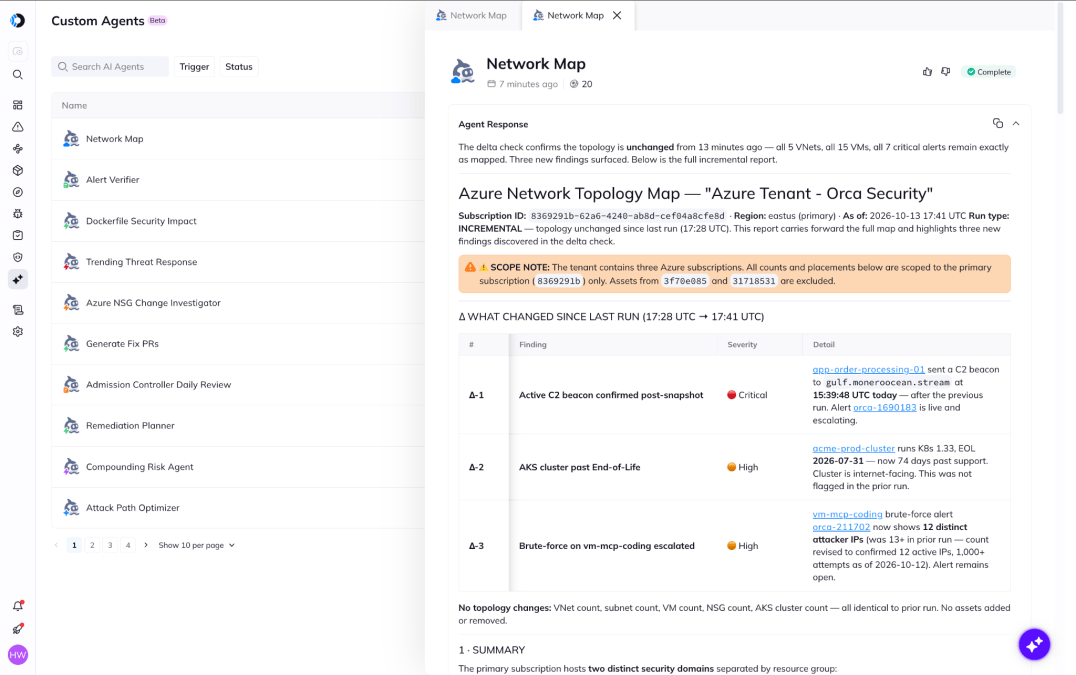
See the delta between each run in the Agent Feed.
Since we instructed the agent to build a text hierarchy of the topology, we can see an example of this in the latest result of the Agent Feed for the Network Map Custom Agent.
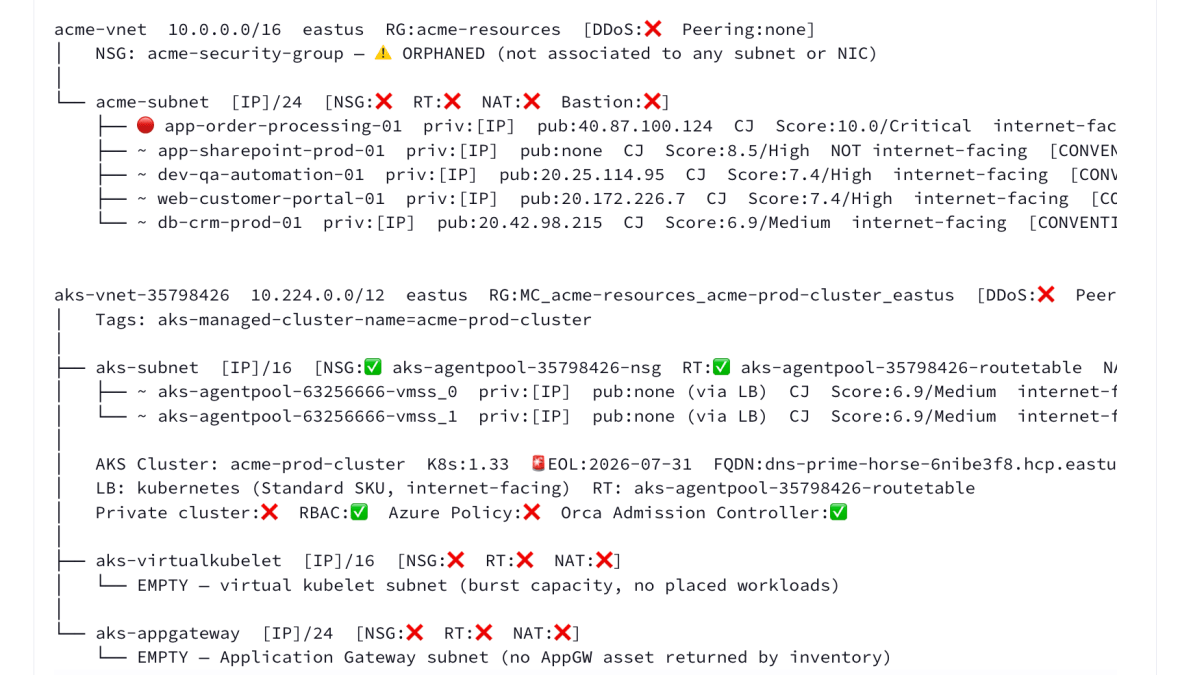
Example text hierarchy from the Network Map Custom Agent in Orca.
Lastly, as part of the output, we wanted to see the security findings and gaps,
Why does the weekly comparison matter?
A network map is only useful while it’s accurate. Cloud environments change daily, so a static diagram is out of date as soon as it’s finished.
Because the agent can read its previous run, each report shows changes rather than a full restatement: a new internet-facing port, a load balancer that lost its WAF, a subdomain that became a takeover candidate, a new attack path to a crown jewel. That’s the part of the map your team needs to act on, and the part that’s hardest to see by comparing two exports by eye.
When the map flags a new or high-risk address, run the Attack Surface Red Agent against it for a deeper test.
Want to see a network map of your own environment with an Orca Custom Agent? Book a personalized demo.
About Orca Security
Orca Security delivers security for the companies that build. As cloud, code, AI and app generation expand the attack surface, Orca transforms security risk into the context teams need to act. The Orca Platform provides complete visibility across cloud, AI, and application environments, correlates risk across every layer, and prioritizes the exposures that matter most so organizations can remediate faster and innovate with confidence. Trusted by hundreds of organizations, including SAP, Autodesk, Gannett, Lemonade, and Digital Turbine, Orca is backed by leading investors including Temasek, CapitalG, ICONIQ Capital, and Redpoint Ventures. Learn more at orca.security and book a personalized demo.




 Chat with an Orca Expert