
No one outside the IT department cares about your vulnerability metrics (or they shouldn’t, anyway). They care about efficacy. And traditional stats don’t show that.
I had a lovely chat with one of my favorite CISOs the other day, helping them think through the security metrics that they report upwards. Front and center, as I see in almost every security metrics presentation, was a pair of my least favorite monthly measurements: average age of open vulnerabilities, and total open vulnerabilities.
I don’t hate a lot of things—okay, actually, I might actually hate a lot of things, but very few things top the professional hatred I have for vulnerability metrics reporting. At best, they are a measurement of activity, not of effectiveness. They remind me of the old firewall reports (“Look at how many port scans we stopped!”), which I’ll admit I had a special loathing for because security teams would block their web teams from using a content delivery network (CDN) simply because they would lose this report. [Disclosure: I used to be CISO at Akamai.]
A Tale of Two Vulnerability Metrics
Why do I hate those two measurements? Well, for starters, what is a vulnerability? This isn’t a weird hypothetical about the difference between a software defect and an architectural flaw. What is one vulnerability? How do you count vulnerabilities? Was log4shell one vulnerability in your organization, or was each system that had a log4shell vulnerability on it counted as one vulnerability? I know of very few enterprises that report metrics on the former, if only because you don’t get to report any successes until you remediate the last system. But let’s look at how that plays out in my two least favorite metrics.
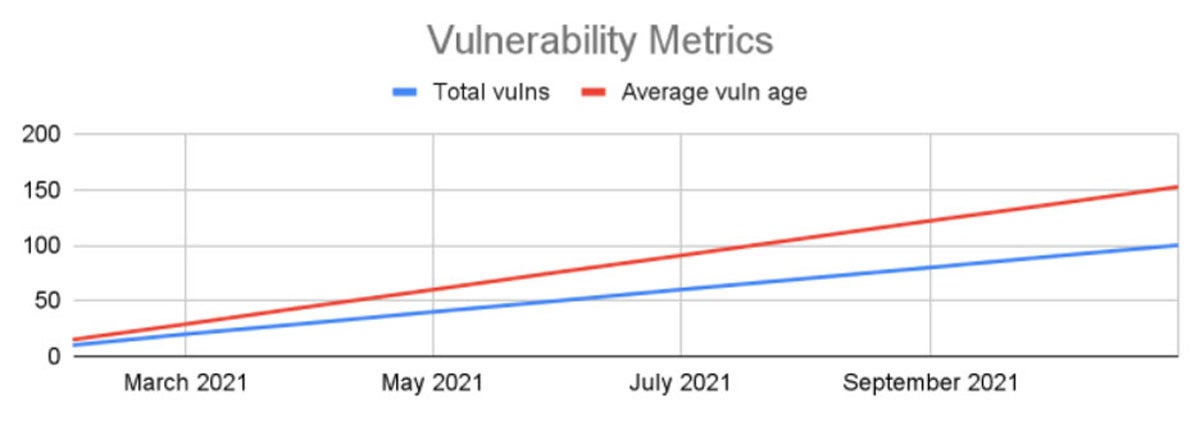
Consider a random company, Andy’s Column Most Exceptional (ACME). ACME isn’t really good at patching its systems, and has 10 systems, each of which has ten open vulnerabilities, which have come in one a month (ACME has only been around for ten months, so at least the technical debt hasn’t needed an act of Congress to raise the debt ceiling … yet). The average age of ACME’s vulnerabilities is 152 days (assuming vulns are, on average, found 15 days before the end of the month, and we report at the end of the month), and ACME has 100 open vulnerabilities.
And yes, I intentionally put these two different measures onto one chart, not because ACME’s hypothetical CISO is lazy when producing graphics, but because you have to really understand vulnerability management to make use of this data, and these two lines together tell a story. Most metrics charts put these separately, and often just as numbers in a grid, which means you don’t see how intertwined they are about to become.
Reporting Vulnerability Metrics on log4j
Then, December hits, and the log4j vulnerability shows up, in addition to ACME’s usually scheduled 1 new vulnerability a month. Consider three alternate worlds: In one, ACME continues not patching. Look at this lovely chart:
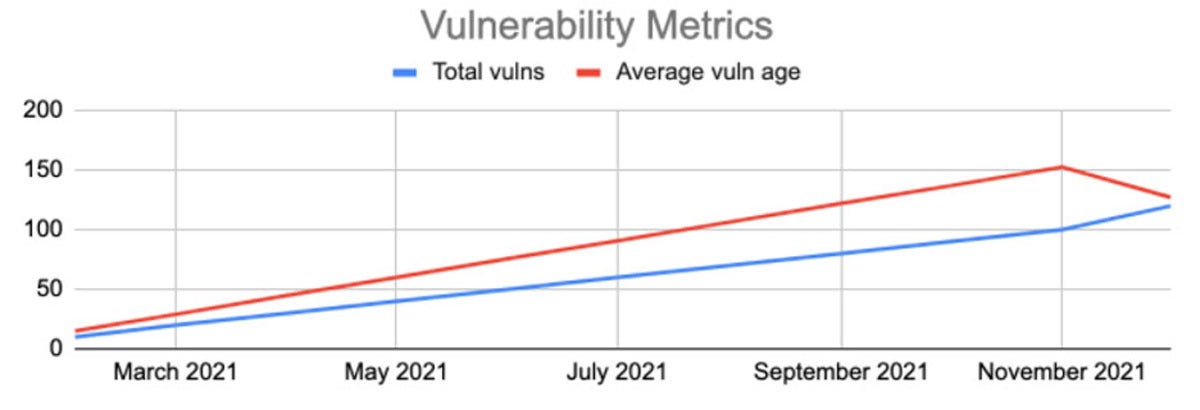
ACME’s average vulnerability age went down! This is gloriously good news to report to the Board. Or, ACME could all hands on deck patch log4j everywhere:
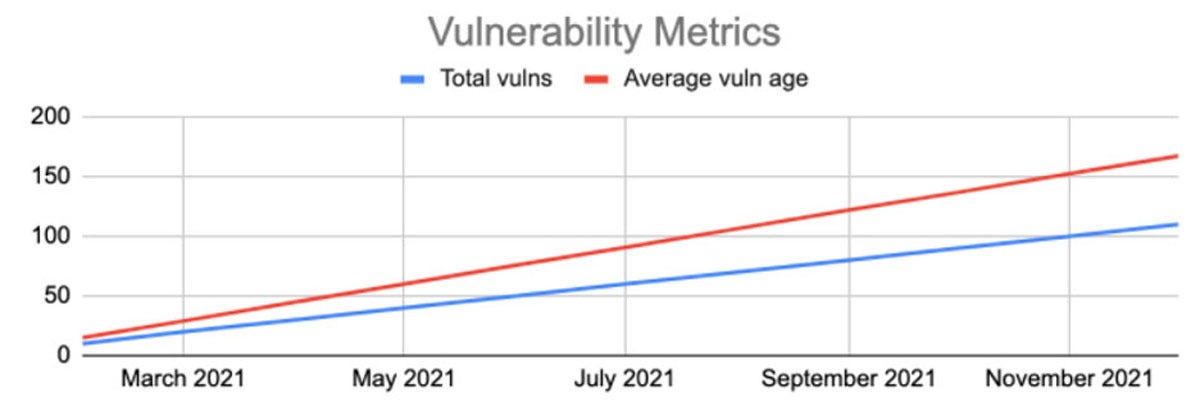
ACME actually did something effective … and it will never appear on the chart. Unless, of course, ACME’s CISO waited to do all of the patching in January:
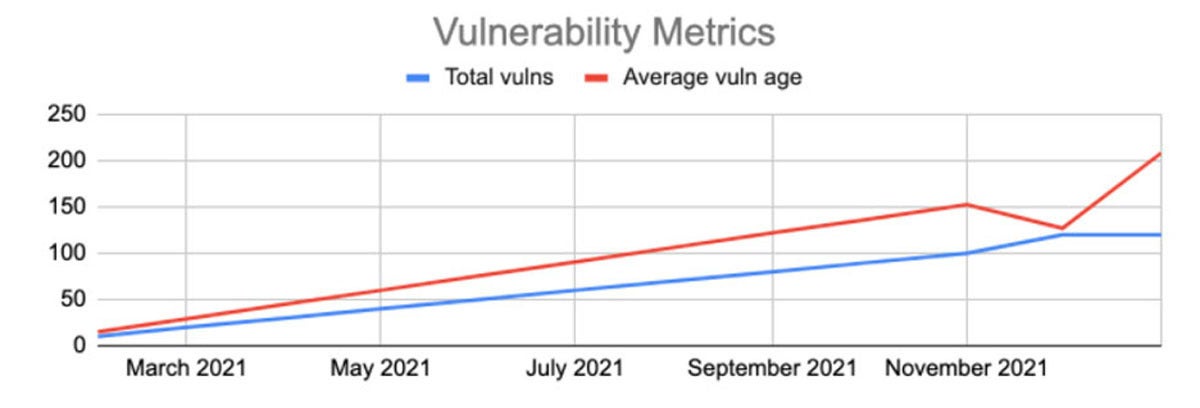
I’m … not sure I’d want to try to explain this chart to my Board or CEO. The bucketing effect created this weird data artifact, which at least showed that we did work, but only as long as you remember that weekend of frantic patching.
Where Vulnerability Metrics Fall Short
Of course, environments are more complicated than what I’m showing in the graphs above, but hopefully you get the point: What you see in the graphs doesn’t tell an interesting story. If you are really good at handling Patch Tuesday, and one month has three vulnerabilities and the next month 15, you’ll have wildly different activity measures, even if you did the same work. But odds are, your environment is always growing, both in size and complexity, and therefore your vulnerability count is going to continuously go up.
No one outside of the IT or security organizations should care about these numbers. Certainly the Board shouldn’t – but I know a lot of CISOs that include these metrics in the absence of anything else. What should the CISO, CEO, and Board care about?
Your program’s efficacy.
Efficient Vulnerability Management for Critical Systems
Do you have a security program that addresses vulnerabilities? Can you simply describe it, like “For critical systems, all impactful vulnerabilities are patched within 30 days if they are high severity, and 90 days otherwise”? Great!
Now, how many systems meet that definition (critical), and how effectively you actually meet those SLAs. No one expects you to be perfect, but are you hitting that SLA ten percent of the time? Fifty percent? More? Now that’s an interesting way to measure maturity, that is comparable between different months. It isn’t perfect, of course, but it’s a step in the right direction. Because a CISO’s goal is to have a more mature program that will continue to address risks without needing crisis management.
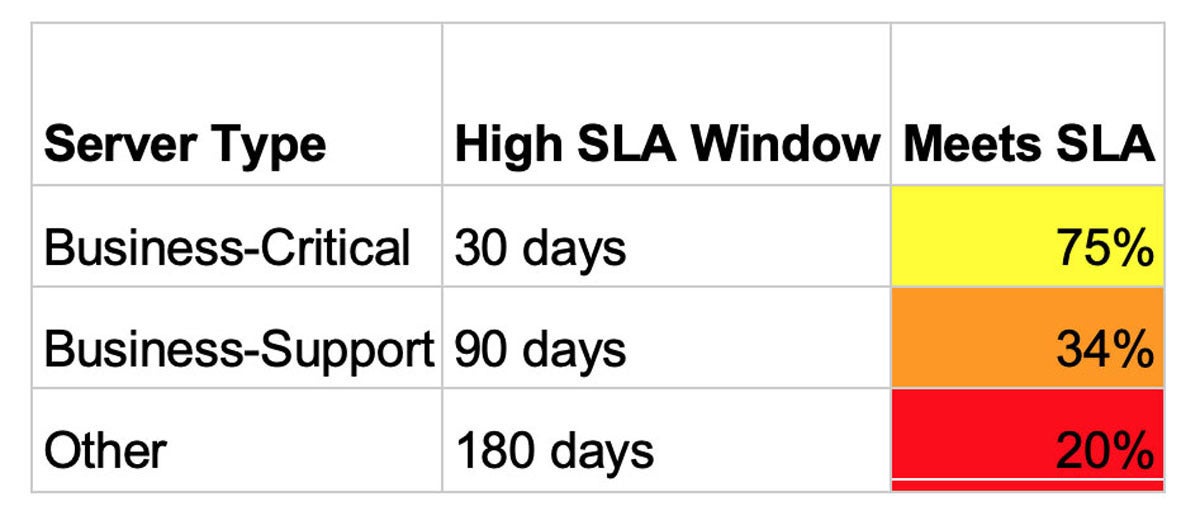
Consider this measurement, which quickly allows a business to see the different SLA windows for patching “high” vulnerabilities and tells you how often different types of systems meet those windows. Clearly there is more work for this enterprise, but we aren’t confusing the business-critical systems with test environments.
Efficient vulnerability management for your multi-cloud estate is within reach. Schedule a free cybersecurity risk assessment, and try out Orca Security for 30 days.
Editor’s Note: This article originally appeared on CSO Online.


