“Defenders think in lists. Attackers think in graphs,” is a familiar saying in cybersecurity. Sophisticated attackers perform reconnaissance to find out which systems connect to each other in the target environment, in order to reach their end target. There is no reason, however, that cloud security teams can’t also think in graphs and see their environment in the way an attacker does.
Since inception, the Orca Cloud Security Platform has aided security teams in better understanding all of their cloud risks and their organization’s overall risk status in a prioritized way.
Now, we’re building on these capabilities with our newly introduced interactive graph visualization views that help our users gain a complete picture of the relationships between cloud entities and risks that can often impact multiple entities. With these insights, security teams can be one step ahead of attackers and understand which risks should be strategically remediated to achieve the greatest reduction in the attack surface.
Why cloud relationships are complex
Cloud environments are diverse and interconnected, so understanding relationships between entities is a challenge. Due to the ephemeral nature of the cloud, in which assets are spun up and torn down on demand, it is difficult to have continuous visibility. In addition, as cloud data becomes more prolific, and applications become larger and more complex, it is increasingly difficult to understand how vulnerabilities, IAM misconfigurations, exposed infrastructure, and other risks can directly or indirectly expose the company to a potential data breach.
Orca’s interactive graph view provides intuitive insight into cloud relationships
Whether you’re monitoring and securing virtual machines, storage buckets, containers, their network connections, their exposure level, databases, or other elements, knowing the relationship between any of these entities is of the greatest strategic importance.
Leveraging Orca’s patented SideScanning™ technology and insights into the cloud control plane, the Orca platform provides security teams with comprehensive visibility of cloud assets, data, workloads, applications, APIs, identities, and more, including detailed contextual information.
With Orca’s new interactive graph view, it is now easier for security teams to understand the relationship between cloud entities. While graphs have already been available as part of our API Security capabilities—showing the connections between applications, domains, subdomains, path groups, users, and API endpoints—they are now an integral feature across the Orca Platform. Customers can use the Orca Discovery Query Builder to query the relationships between any cloud resources and see the corresponding results in graphs, as well as click on graph entries to further explore relationships.
The new graph visualization capabilities enables security teams to:
- Find out which cloud assets (VMs, storage buckets, containers and much more) have the most relationships
- Explore more information about an asset, including relevant alerts, vulnerabilities, potential attack paths, sensitive data, and more
- Quickly identify and filter by Internet-facing assets vs. non-Internet facing
- Group by additional contextual fields i.e “group containers by installed applications”, providing an additional layer of visibility and a customizable user experience.
A closer look at a use case
Let’s take a look at an example of how Orca’s new graph view delivers value to security teams.
Find problematic cloud images by visualizing both how vulnerable and exposed they are
Let’s say you want to identify how widely used and potentially vulnerable a particular cloud image is. One thing you would need to know is the connections between that image and the virtual machines spun up from it.
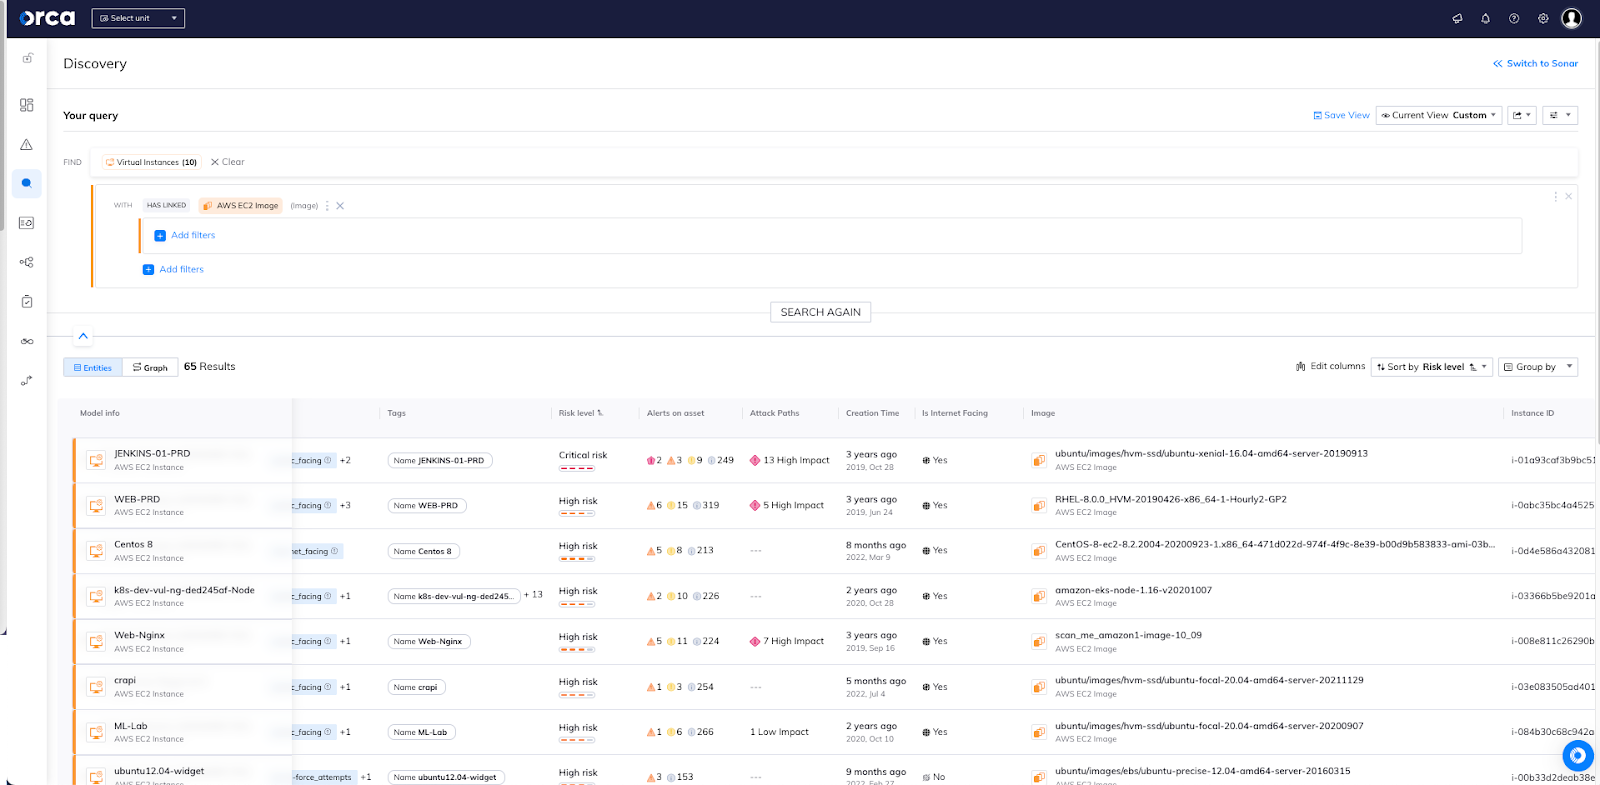
In the screenshot below, you can see a list of results using the Discovery Query Builder. In this example, we see 65 virtual instances that are linked to an Amazon EC2 image. However, if we now want to find out which images are being used by the most VMs, the table results isn’t the easiest way to highlight the relationships.
Now, look at the same query results, using Orca’s graph visualization.
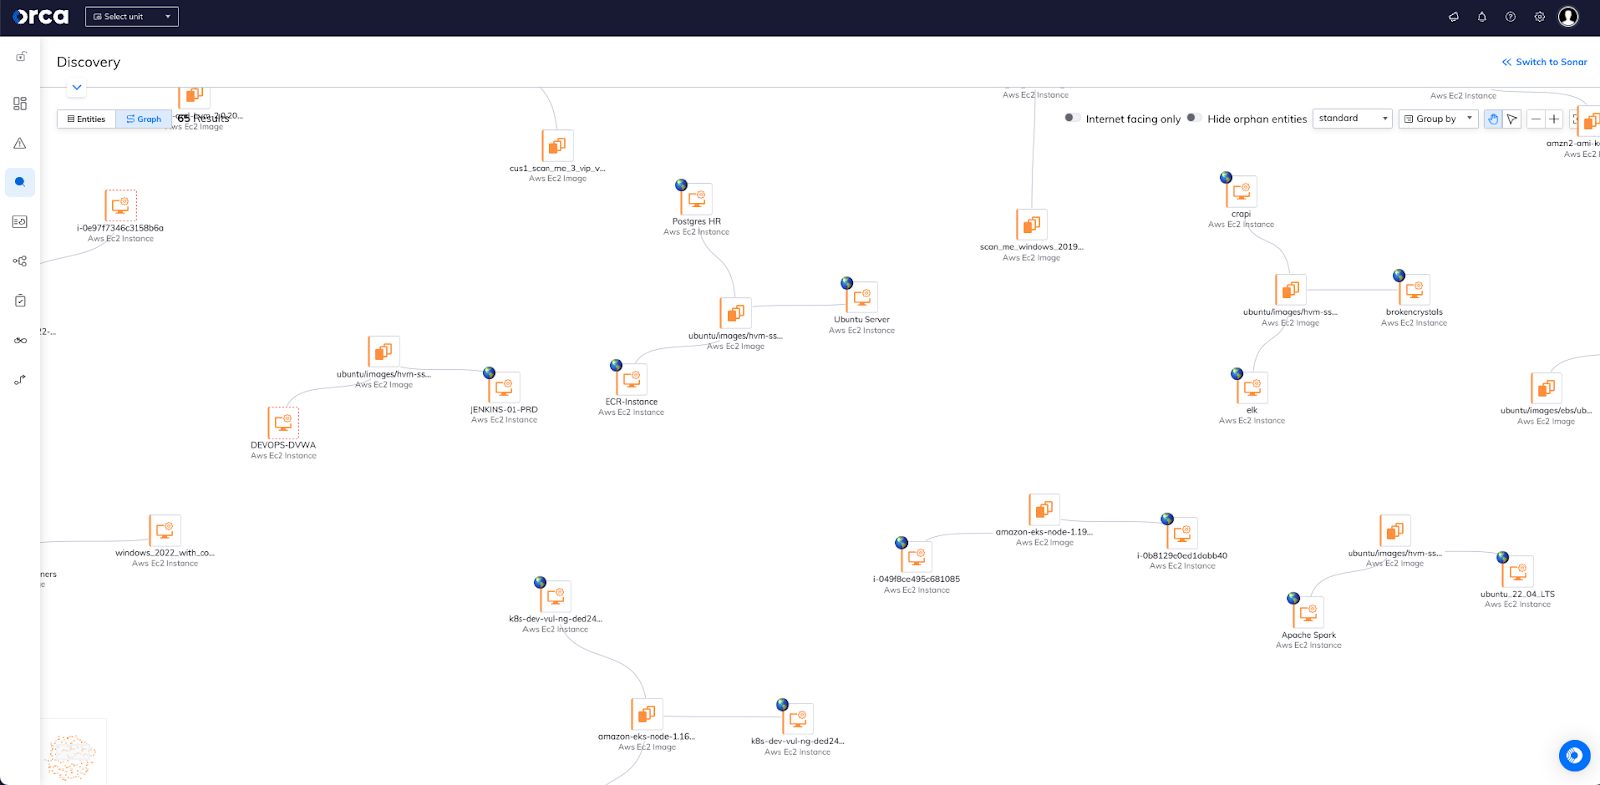
Now it is easy to see the connections between the VMs and the images and to visually determine which images are used by the most VMs. Let’s zoom in a bit more, showing examples of images connected to only a single VM, as well as an image being shared by three VMs.


Note that the Ubuntu12.04-widget instance is not Internet-facing in this environment, while the three VMs below are all Internet-facing.
So, we have an image attached to multiple internet-facing VMs, and a single non-internet-facing VM attached to a different image. When facing multiple vulnerabilities on different images, since you will achieve a greater reduction in the attack surface.
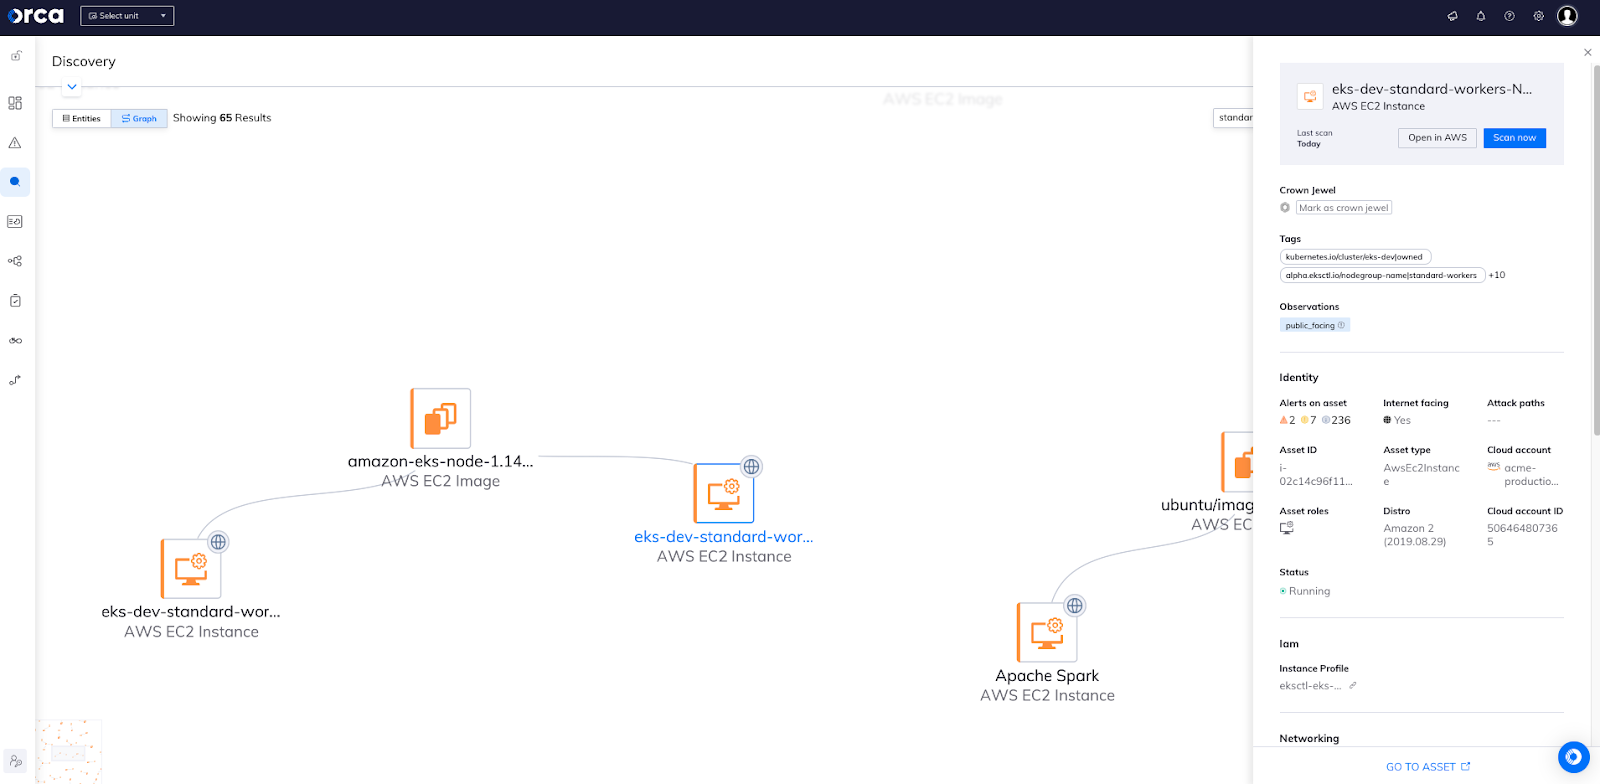
By clicking on any asset in the graph, you’ll be shown the “quick view” asset information associated with it—including security and compliance alerts on asset, related attack paths, asset ID, connected cloud account, and more—as shown in the screen below. This gives users immediate access to explore more about each asset in a user-friendly, context-rich way.
Start using Orca’s interactive graphs today
If you are an Orca customer, you can immediately begin leveraging the value of Orca’s graphs by clicking on the ‘Graph’ tab in dashboards. In addition you can view graphs in the Discovery Query Builder by clicking on the discovery icon on the left navigation bar and begin building and saving some of your most valuable and frequent queries.
If you are not an Orca customer and would like to see our new interactive graphs in action, schedule a 30-day free trial and experience the comprehensiveness and simplicity of securing your entire cloud estate with Orca’s agentless platform.