Observability is the ability to measure, monitor, and understand the internal state of a system based on the data it produces—such as logs, metrics, and traces. Originally a control theory concept, observability in modern computing enables engineers and security teams to answer key questions about application behavior, performance, and reliability without needing direct access to the system’s internals.
In cloud-native, containerized, and distributed environments, observability is critical for diagnosing issues, ensuring uptime, optimizing performance, and detecting security incidents in real time.
What is observability?
Observability refers to how well you can understand what’s happening inside a system from the outside. It is not just about collecting data—it’s about using that data to answer why something is happening, not just what is happening. This enables teams to investigate root causes, understand dependencies, and take proactive or corrective action quickly.
In practice, observability is achieved through the collection and correlation of three primary telemetry pillars:
Logs: Immutable, timestamped records of discrete events generated by applications, infrastructure, and services. Logs provide detailed context for what occurred at a specific point in time.
Metrics: Numeric measurements captured over time that quantify system health, usage, and performance (e.g., CPU usage, memory consumption, HTTP error rates). Metrics are typically aggregated and monitored for trends or thresholds.
Traces: End-to-end records of how a request moves through a system or service chain. Traces help identify bottlenecks, latency issues, or failures in distributed applications.
These three pillars are often supplemented with events, metadata, and topology information to provide a holistic view of system behavior.
Why observability matters
Modern applications are complex, often built using microservices, serverless functions, containers, and APIs deployed across cloud and hybrid environments. Traditional monitoring tools fall short in these architectures because they focus on static metrics or predefined alerts without the context needed to troubleshoot dynamic, ephemeral systems.
Observability matters because it enables teams to:
- Detect and resolve performance issues faster by identifying root causes
- Improve user experience by reducing downtime and latency
- Understand the impact of changes or deployments in real time
- Monitor service dependencies and uncover cascading failures
- Detect anomalies or malicious activity that may indicate a security breach
- Support SRE (Site Reliability Engineering) practices, SLAs, and error budgets
- Continuously improve systems through feedback loops and empirical data
Observability provides the insights needed to maintain reliability and resilience at scale.
Observability vs. monitoring
While often used interchangeably, observability and monitoring are not the same:
Monitoring tells you when something is wrong—often through predefined dashboards and alerts based on known thresholds.
Observability helps you understand why it’s wrong—even in the face of unknown unknowns. It emphasizes the ability to ask new questions and explore telemetry in ways that weren’t anticipated during system design.
Monitoring is necessary but not sufficient for diagnosing complex problems. Observability adds the exploratory and diagnostic capability needed in dynamic environments where traditional assumptions don’t always apply.
Observability in cloud-native environments
In cloud-native environments, observability is both more essential and more challenging. Containers, Kubernetes, and serverless functions create highly dynamic and short-lived components that require automated, scalable telemetry collection and analysis.
Key observability challenges in these environments include:
- Ephemeral workloads: Containers may spin up and down in seconds, requiring real-time data collection and aggregation
- Distributed traces: A single user request may traverse dozens of microservices, requiring end-to-end visibility to trace failures
- Multi-cloud complexity: Organizations may run services across multiple providers, each with different telemetry standards and APIs
- Security visibility: Observability data is often the first indicator of compromise, making it valuable for detecting threats and anomalies
- High data volume: The sheer amount of telemetry generated can overwhelm systems without careful sampling, filtering, and prioritization
Tools and frameworks such as OpenTelemetry, Prometheus, Fluentd, Jaeger, and Grafana are commonly used to collect, process, and visualize observability data in cloud-native systems.
The role of observability in security
While traditionally viewed as a performance and reliability concern, observability is increasingly important in security operations. Observability data can help:
- Detect abnormal behavior, such as sudden spikes in resource usage or failed login attempts
- Correlate events across systems to identify lateral movement or privilege escalation
- Reconstruct attack timelines using logs and traces
- Validate that cloud workloads and configurations comply with security policies
- Investigate data exfiltration, malware activity, or insider threats
- Support forensics and incident response through immutable, time-stamped data
Security observability bridges the gap between detection and response—helping teams move from passive monitoring to active threat hunting and resolution.
Observability best practices
To build effective observability, organizations should:
- Instrument early and often: Integrate telemetry collection into code, infrastructure, and CI/CD pipelines
- Correlate across data types: Combine logs, metrics, and traces for full context rather than siloed insights
- Use centralized platforms: Aggregate data from disparate sources into a single observability platform for unified analysis
- Set meaningful SLIs and SLOs: Track service-level indicators and objectives that reflect user experience and business goals
- Embrace open standards: Use vendor-agnostic tools like OpenTelemetry to ensure portability and integration flexibility
- Automate alerting: Use machine learning and anomaly detection to surface unexpected issues faster
- Protect sensitive data: Ensure observability tools are configured to avoid leaking PII or exposing sensitive system details
Observability should be seen as a continuous discipline—evolving alongside application architecture and user needs.
How Orca Security helps
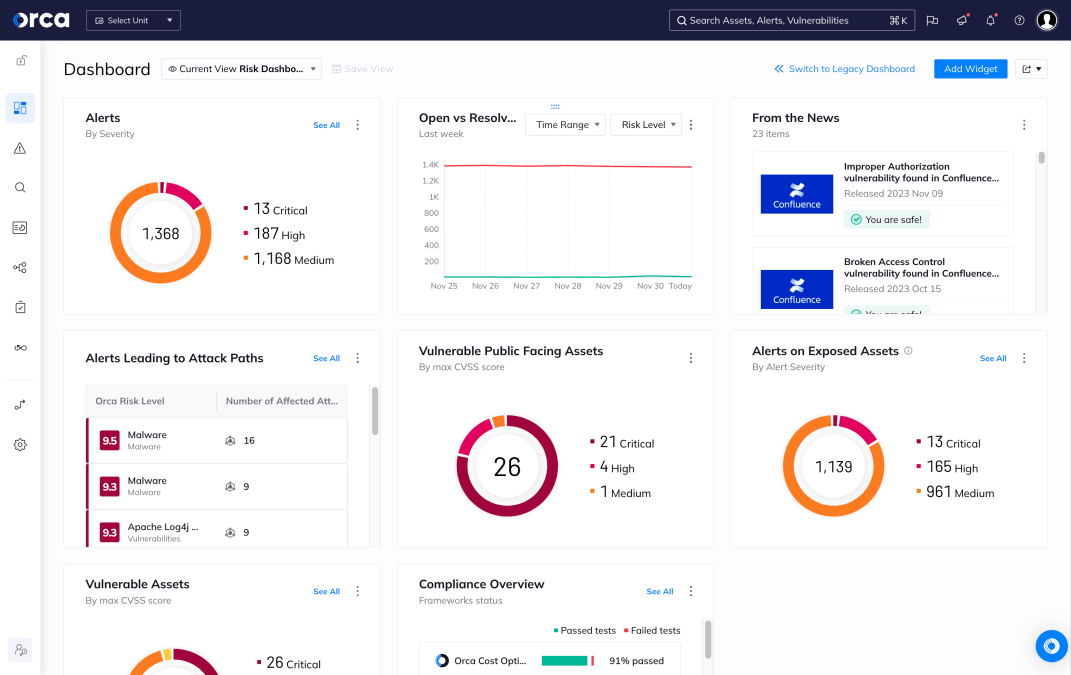
The Orca Cloud Security Platform enhances observability by providing deep comprehensive visibility across the multi-cloud environments of AWS, Azure, Google Cloud, Oracle Cloud, Alibaba Cloud, and Kubernetes.
With Orca, security and operations teams can:
- Analyze risks holistically to detect the root source of issues
- Surface the attack paths that endanger high-value assets and visualize cloud asset relationships continuously and dynamically
- Scan and monitor cloud assets continuously for risks and threats, including anomalies, suspicious activity, and potentially malicious behavior
- Prioritize remediation based on business impact and dynamic measures of criticality
By combining deep and comprehensive visibility with risk context, Orca enables teams to gain the cloud-native observability that supports effective risk prioritization and remediation.


